Test

Test

If you add a great user experience to a product no one wants, they will just realize faster that they don’t want it. – Eric Ries, The Lean Start up Author
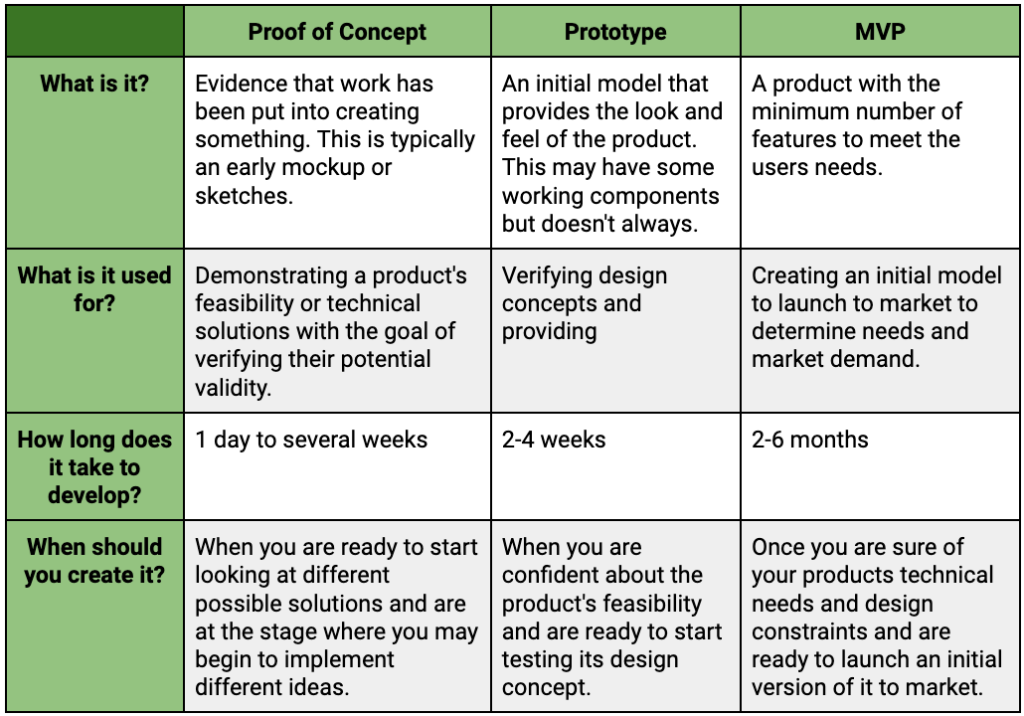
A minimum viable product (MVP) is a version of a product with just enough features to be usable by early customers who can then provide feedback for future product development. A focus on releasing an MVP means that developers potentially avoid lengthy and (possibly) unnecessary work.

Your MVP will be the most basic functioning product that allows you to test your business assumptions against the real deal— your actual intended userbase.
Source: LeanB2B
Source: Codelation

Peter Drucker, Management Theorist & Consultant
The famous expression of “What gets measured, gets managed” by one of the most influential thinkers on management, Peter Drucker is very true when in comes to KPI’s. Key Performance Indicators or KPI’s are increasingly key to allowing you to understand and manage your business. They allow users to quickly identify trends, encourage managers to take action when a KPI’s score drops and allows the manager to identify the outcome of the change taken measure its impact on the business. Ultimately as a manager you are wiser for having made the decision to make a change and measured the outcome.
Not all changes made will be the correct change, however though effective KPI’s you will quickly identify if you have applied the correct change or not, and will apply another change if not. Ultimately you are wiser for having made the decision to make a change and having learned what changes worked and what changes that did not work and to what extent thanks by measuring the impact of your changes through KPI’s.
In this post we will look at a variety of different ways in which you can measure your business, but before we begin, firstly a word of caution on Vanity Metrics or KPI’s.
What are Vanity Metrics?
Vanity metrics are those metrics that make a person feel better about themselves without providing them without any guidance or actionable information.
Vanity Metrics vs Actionable Metrics
Vanity metrics often lack context, for instance measuring web traffic or followers can be vanity metrics if measured in isolation and they are not supported by strong conversion or average spend, time on site, repeat traffic etc. It is important to make sure that creating your KPI’s that you are creating them to produce findings that facilitate actionable information to support decision making.
Lead Generation
Lead Generation is effectively the amount of traffic that you are bringing to your business, be it website traffic or footfall and this should be measured in conjunction with your pricing strategy to optimise business performance by providing off peak specials or increasing prices during peak times to maximise profitability.
Average Spend Per Customer/Transaction
Increasing Average spend is one of the most effective ways of growing revenue and profitability. Acquiring new customers is expensive, therefore improving customer retention, combined with increasing average spend or frequency of spend are key ways of increasing profitability as they avoid the business having to incur new customer acquisition costs for driving revenue growth.
Conversion Rate
Conversion rate measures the percentage of traffic into transactions and is an important metric for assessing sales and marketing campaigns.
Conversion Rate Formula = # of Transactions / Total Traffic (Web sessions or footfall)
Customer Acquisition Cost (CAC)
CAC measures the sales and marketing cost of acquiring a new customer.
CAC = Total Cost of Sales & Marketing / Number of Customers Acquired
Example: Cost of Sales & Marketing (€20,000) / Number of New Customers (1,000) = €20 CAC
LTV:CAC Ratio
This is a truly powerful KPI to effectively and profitably scale your business. Customer acquisition cost (CAC) measures how much a company spends on customer conversion Customer lifetime value (LTV) measures the amount a company can expect to make from a single customer Combining CAC and LTV to create the LTV to CAC ratio can help determine a cost-efficient business strategy
LTV vs CAC Formula : = Customer Lifetime Value ((LTC)/Customer Acquisition Cost (CAC)
LTV:CAC Benchmarks
If you are a scaling SaaS business your LTV:CAC ratio should be more between 3-5. A lower ratio means that you may not have product-market fit. A higher ratio (above 5) is an opportunity to invest more in sales and marketing. A ratio of less than 1 means lost revenue on every customer.
Measure Addressable and Obtainable Market to Determine Market Size
Market size is a key component of product-market fit—if the market isn’t large enough, it won’t be able to sustain your business. If you know (or suspect) the market has changed, it’s worth it to conduct that research again.To calculate your market size, determine your:
The sign of a good market for your product is a SOM that’s large enough to be profitable for your company while remaining realistic for your business model.
Measure Growth Rate and Profit Margin for Company Performance
Taken together, your growth rate and profit margin can give you an idea of how well you’ve achieved product-market fit. This is based on the “Rule of 40” (or Rule of 40%), a common approach among SaaS companies to gauge their growth potential.
To calculate this metric, add your growth rate and profit margin together. If they equal 40 or more, that’s a sign your company has achieved sustainable, profitable growth—and that’s an indicator of product-market fit.
Note that this metric is more of a rule of thumb. It’s a quick way to gauge growth, but it shouldn’t necessarily form the basis of your product management strategy.
Measure Customer Acquisition and Lifetime Value to Calculate Company Health
Your customer acquisition cost (CAC) should be lower than your customer lifetime value (CLV)—otherwise, your company won’t be able to grow profitably. Your CAC equals the cost associated with sales and marketing for your product divided by the number of new customers you’ve acquired. Your CLV equals your customer value multiplied by your average customer lifespan.
You can look at these two metrics together as a ratio:
LTV / CAC = Your ratio
A ratio of at least 3 is a good sign you’re acquiring enough long-term customers to offset your costs and sustain growth for your product, which suggests you’ve found a comfortable product-market fit.
Measure Customer Retention to Check for Product Stickiness
A high customer retention rate goes along with high customer lifetime value. A sticky feature set is a sign of value: you’re serving your customers’ needs well enough they keep coming back to your product.
The benchmarks for customer retention rate vary depending on your industry and goals. That said, the average monthly rate for B2B SaaS companies is between 92 and 97% (that’s a churn rate between 3 and 8%).
To measure your customer retention rate, follow this formula:
(Total number of customers at the end of a given time period – Number of new customers acquired during that time) / Number of existing customers at the start of your time period x 100
Source: UserVoice.com
Customer Churn Rate
Customer Churn Rate is defined as the annual percentage rate of customers that stop subscribing to a service.
Customer churn rate = (number of customers lost during the time period) / (number of customers at the start of the time period). Businesses should look to keep their churn rate as close as possible to 0%
Churn Rate Example: Customers Lost (10)/Customers at Start of Period (200) = Churn Rate of 5% (10/200)
Monthly Recurring Revenue (MRR)
Your Monthly Recurring Revenue growth rate is a key metric for any business (and sales team) as they scale up operations to track in order to monitor the customer base and their engagement towards the product or service. MRR calculations also help predict future revenue with data-based forecasting.
MRR Formula: multiply the monthly subscribers by the average revenue per user (ARPU)
Financial KPI’s will be covered in a separate post.
Net Promoter Score (NPS)
Sourced from a single-question survey, this gold standard customer experience metric gives you a singular picture of customer loyalty. Customers respond with values ranging from 0 to 100, where you will be aiming for the higher end of the range. You get promoters from those who score 9 or 10, passive from those who score 8 or 9 and detractors from those who give you a score of 0 to 6.
Measure your NPS by subtracting the number of detractors from the number of promoters. If you have 10% detractors, 10% passives and 80% promoters, your figures would be: 80%-10% = 70 NPS.

Product Market Fit was defined by Marc Andreeson as “being in a good market with a product that can satisfy that market.”
Product Market Fit along with Cash-flow are the two most important things for start ups to manage. Unfortunately most Business’s fail before reaching PMF.
According to research by CB Insights, most business fail due to ‘No Market Need’ for the product or to put it another way, the business failed to reach Product Market Fit. In essence what the report tells us is that most start ups fail because they spend time and money building a product that people don’t want or value.

To put it simply, market is the most important, as having the best team or product is no use to you if you are not operating in the right market in terms of size and growth potential. The focus of the company should be to maximize your chances of success by focusing on achieving PMF (Product Market Fit).
Once PMF has been achieved, as in the case of Product A in the chart below, (represented in the blue line below), you will achieve a leveling off in retention. Once a business achieves Product Market Fit (PMF) they can then scale exponentially as demand surges. Without PMF companies waste money on customer acquisition costs, whilst experiencing high levels of churn or low retention. With PMF companies experience high levels of retention as with Product B below and demand soars as word of mouth spreads and people rush to purchase.

source uservoice.com PMF Blog
Your customer acquisition cost (CAC) should be lower than your customer lifetime value (CLV)—otherwise, your company won’t be able to grow profitably . Your CAC equals the cost associated with sales and marketing for your product divided by the number of new customers you’ve acquired. Your CLV equals your customer value multiplied by your average customer lifespan.
You can look at these two metrics together as a ratio:
LTV / CAC = Your ratio
A minimum ratio of 3 is a good indicator that you’re developing enough long-term customers to offset your costs and sustain growth for your product, which suggests you’ve found a comfortable product-market fit.
A high customer retention rate goes along with high customer lifetime value. A sticky feature set is a sign of value: you’re serving your customers’ needs well enough they keep coming back to your product.
Customer retention rates vary by industry. The benchmark for B2B SaaS companies should be between 92% and 97%, or a churn rate between 3% and 8%.
To measure your customer retention rate, follow this formula:
(Total number of customers at the end of a given time period – Number of new customers acquired during that time) / Number of existing customers at the start of your time period x 100
NPS is a measure of how likely your customers are to promote you to a friend and therefore an indicator for product market fit. NPS is calculated by people scoring your business on a rating from 0 to 10. Those that score your company a 9 or 10 are promoters, while those who score your business or product at a score between 0 and 6 are detractors.
NPS highlights your business ability to grow by word of mouth and an ability to retain customers and drive organic growth once they come in contact with your business.
How to calculate NPS:
Percentage of Promoters – Percentage of Detractors = NPS
The higher the score the higher the ability to drive organic growth which indicates a higher level of product market fit. Product Market Fit NPS scores varies by industry, but generally speaking a score of 72 or higher is considered as being product market fit.
Another way to measure product-market fit is the “40% Test,” developed by Sean Ellis to assess your product’s value to users. The 40% Test asks your customers what their response would be if your product left the market? If at least 40% of your customers would be very disappointed in that scenario, that’s a good indicator you’ve found product-market fit. This question is usually asked in a user feedback survey with these possible responses:
Keep in mind that to satisfy the 40% Test, you’re looking for at least 40% of your users to respond with “very disappointed” and not “somewhat disappointed.” source uservoice.com PMF Blog
